


![Average Land Surface Temperature [Day]](/images/datasets/132x66/MOD_LSTD_CLIM_M.jpg)
![Average Land Surface Temperature [Night]](/images/datasets/132x66/MOD_LSTN_CLIM_M.jpg)


![Land Surface Temperature Anomaly [Day]](/images/datasets/132x66/MOD_LSTAD_M.jpg)
![Land Surface Temperature Anomaly [Night]](/images/datasets/132x66/MOD_LSTAN_M.jpg)
![Land Surface Temperature [Day]](/images/datasets/132x66/MOD_LSTD_M.jpg)
![Land Surface Temperature [Night]](/images/datasets/132x66/MOD_LSTN_M.jpg)


NEO News
Create and Apply the Right Color Palette in Adobe Photoshop for your Map Visualization (Part 1 of 3)
October 16th, 2020 by Andi Thomas
Applying the right color palette to an image is crucial to conveying the right message to your audience. There are obvious no-nos in map-making like, do not color land and water blue because it may look like your entire map is water. Or, do not color a disaster map green because it may convey a message of positivity. This tutorial series will show you how to apply and save different color palettes, but it is important to look into why different colors are chosen, basic color theory, and best practices for choosing the right palette. There is a 6-part series on Earth Observatory published several years ago called the “Subtleties of Color” that is still a great base to start from before making and applying your own palettes. If you already feel comfortable with your knowledge and use of colors, let’s make color palettes!

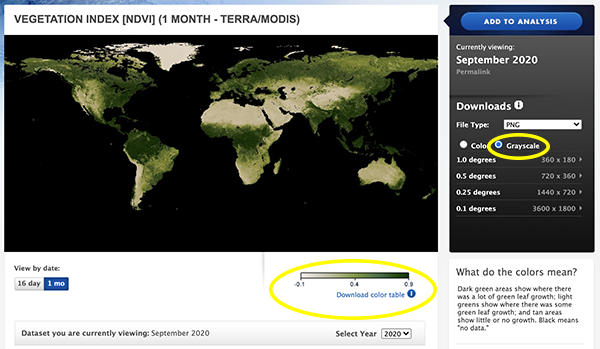
Each NEO image is natively grayscale and the color table is applied in post-processing to display the colored image on each dataset’s page. Underneath the image is a downloadable Adobe Color Table (ACT) that can be saved and used to create and save color palettes for other grayscale images.
Let’s look at the Vegetation Index (NDVI) MODIS imagery as an example for applying a ready-made color table for the dataset following these steps:
Step 1. Download and save the color palette displayed for the NDVI imagery (filename: modis_ndvi.act) and a grayscale PNG at the temporal and spatial resolution of your choice. I saved the files to my desktop so they would be easy to find.
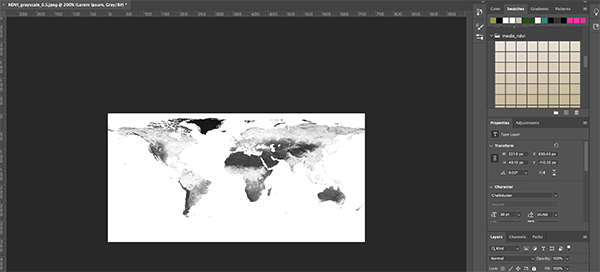
Step 2. Open Photoshop and load the grayscale NDVI image into a new project.
Step 3. Make sure the swatches window is open. There should be a check mark next to “Swatches” and the window should appear on the top right.
Step 4. In the swatches window, expand the hamburger button on the right and click Import Swatches
Step 5. Navigate to where you saved the ACT file and open the file. You should now see the color palette in the Swatches window under its filename and you will be able to access it later and even reuse some of the colors for your own palette creations.
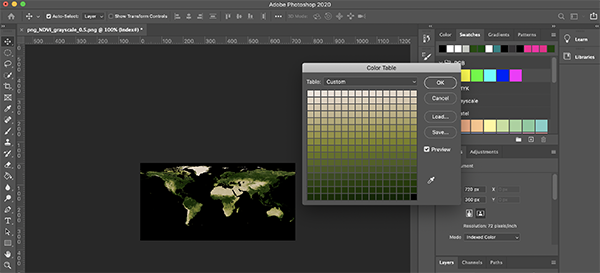
Step 6. Now go to Image, Mode, and select Indexed Color. Keep the default settings and click Ok. Your image name should have changed to “index”.
Step 7. Go back to Image, Mode and select Color Table…
Step 8. Select Custom from the drop-down menu at the top of the window and click Load…
Step 9. Navigate to the modis_ndvi.act file, select the file, and click Ok.
Step 10. The color applied to the map should now look the same as what is on our site for the MODIS Vegetation Index dataset.
Now we are ready to move on to part 2 where we will learn how to apply a custom color palette that is color-blind friendly. See you then!
How to Visualize NEO Imagery in Excel
September 15th, 2020 by Andi Thomas
Did you know you can use Excel to visualize raster datasets? If not, follow this short tutorial and find out how.
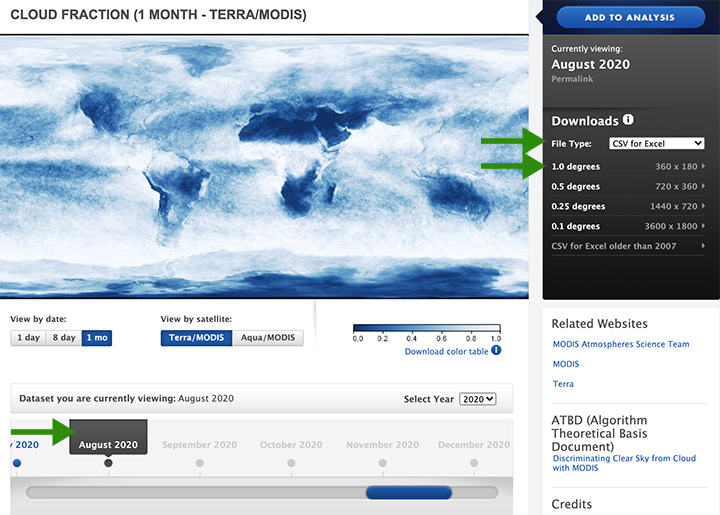
Let’s use the cloud fraction imagery NEO provides for this example.
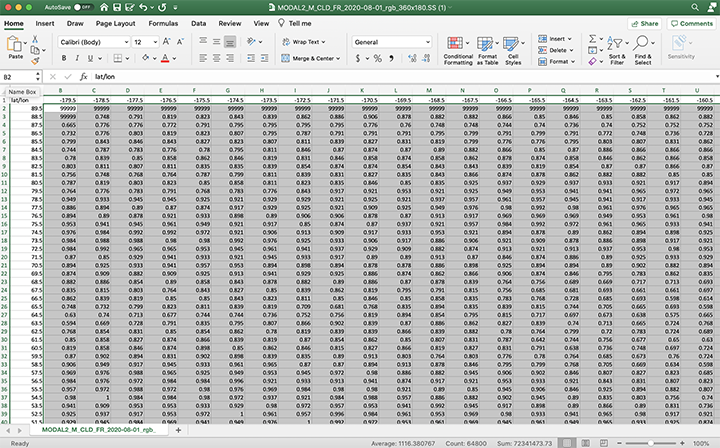
Step 1. Go to the cloud fraction imagery page and choose the CSV for Excel download option from the drop-down at 1.0-degree resolution for a month and year of your choice. I am going to download the latest monthly image for August 2020.
Step 2. Open the CSV in Excel and select all data except for the latitude and longitude row and column (which are the first row and first column).
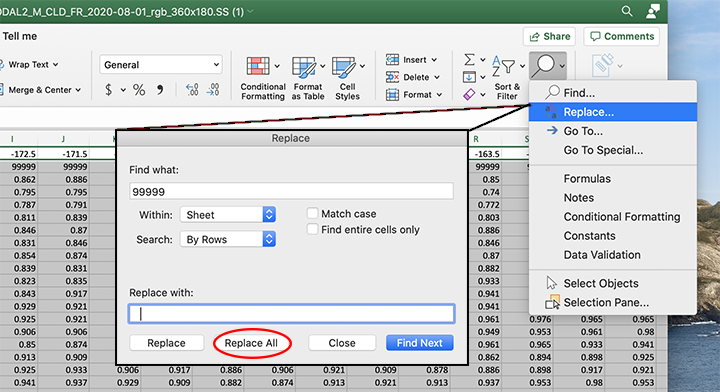
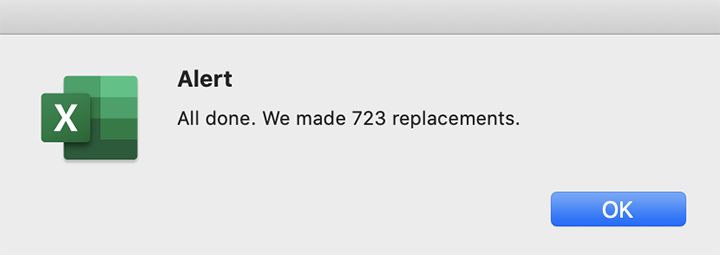
Step 3. Find and replace all 9999 values with an empty cell. I pressed the space bar a couple of times in the Replace with: cell. Once you click the Replace All button, an alert message will come up, and you will notice the cells that previously had 9999 are now empty.
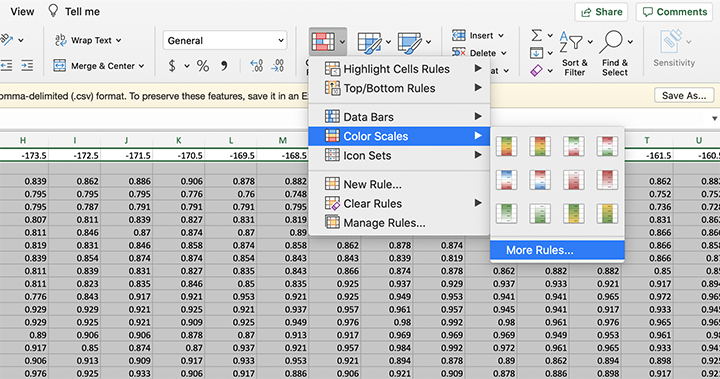
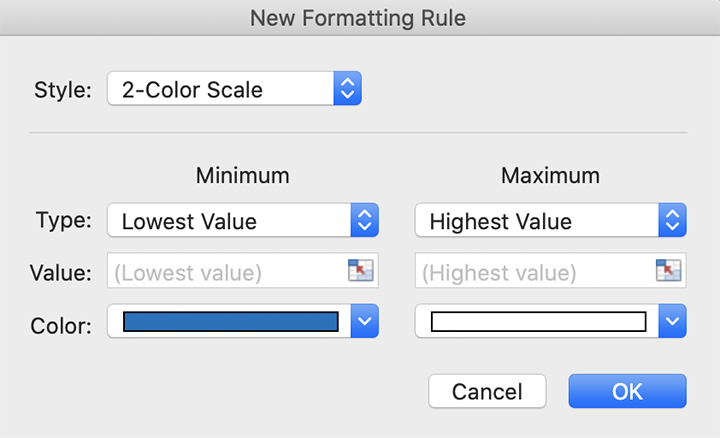
Step 4. From the Excel home tab: Select conditional formatting, color scales, and choose one of the 2-color scheme options available or select More Rules… and choose a different minimum and maximum value color. I am going to choose blue for the minimum color and white for the maximum color to create a look similar to what is available on the cloud fraction page.
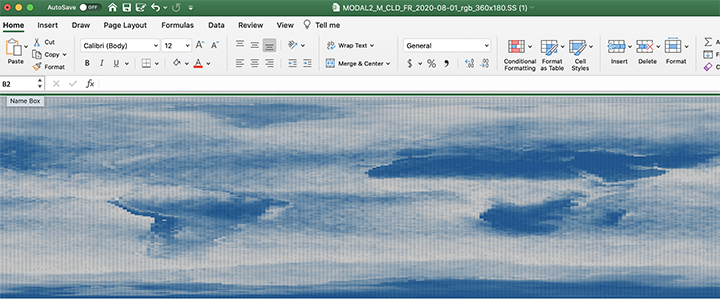
Step 5. Zoom out using the slider on the bottom right side of the excel window and you will notice the global imagery taking shape.
I remember learning the difference between raster and vector data in my entry-level GIS courses. Vector data is all of the point, line, and polygon data while raster data is made of cells or pixels. I wish my professor would have shown me how to visualize raster data in Excel at the time to really grasp cell values that make up the imagery we see as a whole. It certainly would have been easier to process!
Please share what you process in the comments below. We would love to hear any feedback or suggestions you may have.
Comments Off on How to Visualize NEO Imagery in Excel
Questions asked frequently at NEO
September 3rd, 2020 by Andi Thomas
After many years of serving the public with global visualizations of Earth’s system processes, we gathered the most frequent questions visitors of our site ask and answered them for you. The FAQs page can be found on the home page and lives here: https://neo.gsfc.nasa.gov/faq/. Please look these questions over and see if they answer questions you may have had already or discoveries that will help understand our site better.
If you read through the page and still have your own unanswered questions we did not cover, please send us an email using the contact form below and we will make sure you are heard.
Comments Off on Questions asked frequently at NEO
NEO FTP Service No Longer Available
June 13th, 2019 by Kevin Ward
Effective June 13, 2019, the NEO File Transfer Protocol (FTP) service is no longer available. It has been replaced with access via HTTPS.
Comments Off on NEO FTP Service No Longer Available
NEO FTP Service is Retiring
March 15th, 2019 by Kevin Ward
NASA is in the process of deprecating the use of FTP protocol for file access across the agency. As a result, downloading files from NEO via FTP may no longer be available after April 15, 2019. NEO will support bulk downloading options via HTTPS, but FTP client software applications will no longer be able to access NEO holdings. Similarly, if users are using FTP command line utilities or scripts to download from the archive, those will need to be converted to using HTTPS-access methods.
The directories containing the bulk files can be found at https://neo.gsfc.nasa.gov/archive/ Additionally, you may also use our Web Mapping Service (WMS).
For users who have scripts or command line experience, we recommend using either wget or curl to facilitate downloading from the bulk archive. There is quite a bit of documentation and examples that can be found simply by searching, or even just looking at the wget man page, but here are a couple wget examples:
If you want to maintain an up-to-date mirror of a specific directory, retrieving only the PNG files:
wget --no-directories --no-host-directories --no-parent --recursive --mirror --accept "*.PNG" -l1 https://neo.gsfc.nasa.gov/archive/rgb/MOD_LSTD_M/
Same as above, but get only the images from 2007 (for example):
wget --no-directories --no-host-directories --no-parent --recursive --mirror --accept "*2007*.PNG" -l1 https://neo.gsfc.nasa.gov/archive/rgb/MOD_LSTD_M/
If you are not comfortable using command line utilities to download NEO imagery, there is a growing number of graphical interfaces to facilitate downloading over HTTPS. Some are stand-alone applications, some are browser plugins. You can find these applications by searching on “download multiple files from website.”
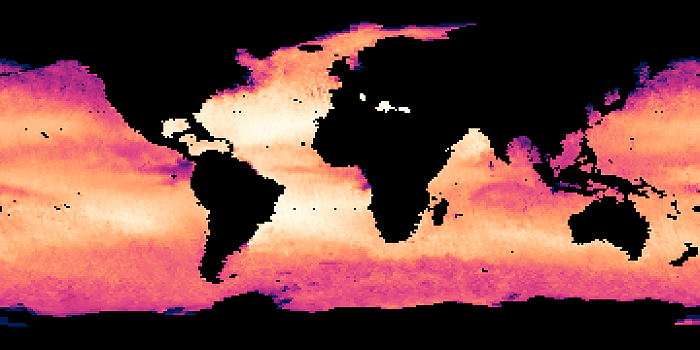
New Dataset: Sea Surface Temperature 1998+ (1 day MWOI)
April 6th, 2015 by Kevin Ward
We have just added a new sea surface temperature dataset to replace the similar data from the defunct AMSR-E instrument aboard NASA’s Aqua satellite. This replacement dataset is a composite from multiple microwave-based sensors (also including AMSR-E) but includes a longer temporal span, beginning in 1998 and continuing to the present.
Read more about this dataset and download imagery on NEO.
Special thanks go out to Remote Sensing Systems for their assistance.
Comments Off on New Dataset: Sea Surface Temperature 1998+ (1 day MWOI)
New Dataset: UV Index
April 30th, 2014 by Kevin Ward
The UV Index is a measure of the intensity of ultraviolet (UV) rays from the Sun. Some exposure to the Sun’s rays is beneficial as it helps our bodies produce vitamin D. But too much exposure to UV rays can have harmful effects. In the short-term, skin exposed to UV rays can burn. A ‘sunburn’ can happen within minutes or over the course of several hours. Over the long term, UV exposure can result in premature aging, skin cancer, and damage to your eyes.
These climatology maps are produced using data collected between October 2004 and January 2011 from the Ozone Monitoring Instrument (OMI) onboard the Aura satellite.
View all the images and read more about this dataset on NEO.
Comments Off on New Dataset: UV Index
Data-like File Formats: CSV and floating point GeoTIFFs
December 23rd, 2013 by Kevin Ward
In addition to the standard file formats that we support in NEO—JPEG, PNG, GeoTIFF, and GoogleEarth—many (not all) datasets support two additional “data-like” formats: CSV (comma-separated values) and floating point GeoTIFF. When you choose one of these formats for download, there are a few details that should be taken into consideration.
- The values that these files contain have been scaled and resampled for visualization purposes in NEO and should not be considered for rigorous scientific examination. At best they are useful for basic analysis and trend detection but if you are interested in conducting research-level science we recommend that you use the original source data (which are not hosted by NEO, but we can assist you in identifying the source).
- CSV files can get quite large at full resolution. For example, a 3600×1800 CSV file can get to around 61MB. If your software has difficulty opening a file of that size then please select a smaller resolution (e.g., 1440×720).
- There are two flavors of CSV available in NEO:
- “Regular” CSV which includes the text-only values at the resolution the user specifies. This format is suitable for Excel (2007 and later) and many other applications.
- “CSV for Excel” In Excel versions prior to 2007, worksheets could not support more than 256 columns. To remedy this, this format option is resized to 250×125. The first row contains the longitude values for the center of the cell and the first column contains the latitudes.
- Floating point GeoTIFFs contain 32-bit numerical data along with the geolocation information that is standard for the Geo format. These files can also get large as they are not internally compressed—e.g., a 3600×1800 GeoTIFF can be around 25MB.
These formats are not available by default in our archive but if you are interested in obtaining a long time series of a dataset in one of these formats, please contact us and we can perform a customized export to the ftp site in the format you need.
New Dataset: Nitrogen Dioxide
November 20th, 2013 by Kevin Ward
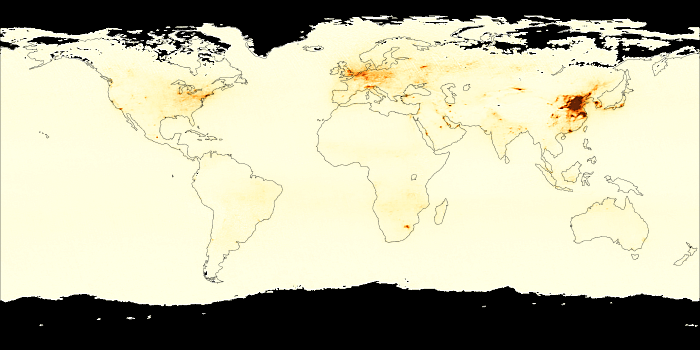
Nitrogen dioxide (NO2) is a gas that occurs naturally in our atmosphere. NO2 plays an important role in the formation of ozone in the air we breathe. Ozone high in the atmosphere helps us. It is like sunscreen, and it protects us from harmful ultraviolet (UV) rays from the Sun. Near the ground though, ozone is a pollutant. It damages our lungs and harms plants, including the plants we eat. Ozone occurs naturally in the air we breathe, but there’s not enough of it to hurt us. Unhealthy levels of ozone form when there is a lot of NO2 in the air. NO2—and ozone—concentrations are usually highest in cities, since NO2 is released into the atmosphere when we burn gas in our cars or coal in our power plants, both things that happen more in cities. Ozone pollution is worse in summer. NO2 is also unhealthy to breathe in high concentrations, such as on busy streets and highways where there are lots of cars and trucks. When driving, it is typically a good idea to keep the car windows rolled up and the car's ventilation set to “recirculate” so as to keep pollution out of the interior of the car. It is also important to reduce outdoor activities like playing or jogging if government officials warn you that air quality will be bad on a certain day.
These maps are produced using data from The Ozone Monitoring Instrument (OMI), on board NASA's Aura satellite and are available in daily, weekly, and monthly composites from October 2004 to the present.
View all the images and read more about this dataset on NEO.
Comments Off on New Dataset: Nitrogen Dioxide
New Dataset: Sea Surface Salinity
August 21st, 2013 by Kevin Ward
The ocean’s salinity is key to studying the water cycle and ocean circulation, both of which are important to Earth’s climate. Differences in salinity play a major role in moving seawater around the globe. Below the wind-blown ocean surface, salinity and temperature drive circulation by controlling the “density” (mass per unit volume) of seawater. The weight of dissolved salt increases water’s density and when salinities are equal, colder water is denser than warmer water. In addition to moving salt and water, density-driven circulation is crucial to moving heat around our planet. The movement of heat by our ocean—for example, from the equator to the poles—is crucial to keeping Earth’s climate “just right.”
These maps are produced using data from the Aquarius instrument onboard the AQUARIUS/SAC-D satellite, a collaborative effort between NASA and the Argentinian Space Agency Comision Nacional de Actividades Espaciales (CONAE) and are available in NEO in weekly and monthly composites.
View all the images and read more about this dataset on NEO.
Comments Off on New Dataset: Sea Surface Salinity
- Browse by Topic
- Analysis
- NEO in the Media
- New Datasets
- Services
- Uncategorized
- Browse by Date
- June 2026
- July 2025
- August 2024
- May 2023
- April 2021
- February 2021
- December 2020
- November 2020
- October 2020
- September 2020
- June 2019
- March 2019
- April 2015
- April 2014
- December 2013
- November 2013
- August 2013
- March 2013
- June 2012
- June 2011
- April 2011
- November 2010
- August 2010
- February 2009
- May 2008
- April 2007