


![Average Land Surface Temperature [Day]](/images/datasets/132x66/MOD_LSTD_CLIM_M.jpg)
![Average Land Surface Temperature [Night]](/images/datasets/132x66/MOD_LSTN_CLIM_M.jpg)


![Land Surface Temperature Anomaly [Day]](/images/datasets/132x66/MOD_LSTAD_M.jpg)
![Land Surface Temperature Anomaly [Night]](/images/datasets/132x66/MOD_LSTAN_M.jpg)
![Land Surface Temperature [Day]](/images/datasets/132x66/MOD_LSTD_M.jpg)
![Land Surface Temperature [Night]](/images/datasets/132x66/MOD_LSTN_M.jpg)


Net Primary Productivity (1 year - Terra/MODIS)
About this dataset
Because carbon dioxide gas helps to warm our world, scientists want to better understand where carbon dioxide comes from and where it goes. Plants play an important role in the movements of carbon dioxide throughout Earth's environment. Living plants both take in carbon dioxide from the air and put out carbon dioxide to the air. So scientists use satellites to measure the difference between how much carbon dioxide is taken in by plants compared to how much is put out by them. This difference is total amount of carbon dioxide taken in by plants, called net primary productivity. The maps here show plants' net primary productivity for the whole globe.
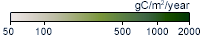
What do the colors mean?
The colors on these maps indicate how fast carbon was taken in for every square meter of land during one year. Values range from 50 grams of carbon per square meter per year (tan) to 2000 grams per square meter per year (dark green).
Get Data
Related Websites
ATBD (Algorithm Theoretical Basis Document)
Credits
Imagery produced by the NASA Earth Observations team based on data provided by the MODIS Land Science Team.
Federal Geographic Data Committee Geospatial Metadata
View the FGDC Metatdata for Net Primary Productivity (1 year - Terra/MODIS)