


![Average Land Surface Temperature [Day]](/images/datasets/132x66/MOD_LSTD_CLIM_M.jpg)
![Average Land Surface Temperature [Night]](/images/datasets/132x66/MOD_LSTN_CLIM_M.jpg)


![Land Surface Temperature Anomaly [Day]](/images/datasets/132x66/MOD_LSTAD_M.jpg)
![Land Surface Temperature Anomaly [Night]](/images/datasets/132x66/MOD_LSTAN_M.jpg)
![Land Surface Temperature [Day]](/images/datasets/132x66/MOD_LSTD_M.jpg)
![Land Surface Temperature [Night]](/images/datasets/132x66/MOD_LSTN_M.jpg)


Permafrost
About this dataset
In really cold places, the ground can stay frozen all year. If the ground stays frozen at least two years in a row, it is called "permafrost." Different places have different amounts of permafrost. It may only occur in patches, or it may cover a large area. The colors on this map show different amounts of permafrost in areas of the Northern Hemisphere. Widespread melting of permafrost is one sign of global warming.
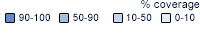
What do the colors mean?
Dark blue shows areas where permafrost is continuous (permafrost over 90-100 percent of the ground area). Medium blue shows areas where permafrost is discontinuous, but still abundant (50-90 percent of ground area). Light blue shows sporadic permafrost (10-50 percent of ground area). Palest blue shows where only isolated permafrost exists (0-10 percent of ground area).
Related Websites
Further Reading
Brown, J., O.J. Ferrians Jr., J.A. Heginbottom, and E.S. Melnikov. 1998. revised February 2001. Circum-Arctic map of permafrost and ground-ice conditions. Boulder, CO: National Snow and Ice Data Center/World Data Center for Glaciology. Digital Media.
Frozen Soils
Picturing Arctic Permafrost
Federal Geographic Data Committee Geospatial Metadata
View the FGDC Metatdata for Permafrost