


![Average Land Surface Temperature [Day]](/images/datasets/132x66/MOD_LSTD_CLIM_M.jpg)
![Average Land Surface Temperature [Night]](/images/datasets/132x66/MOD_LSTN_CLIM_M.jpg)


![Land Surface Temperature Anomaly [Day]](/images/datasets/132x66/MOD_LSTAD_M.jpg)
![Land Surface Temperature Anomaly [Night]](/images/datasets/132x66/MOD_LSTAN_M.jpg)
![Land Surface Temperature [Day]](/images/datasets/132x66/MOD_LSTD_M.jpg)
![Land Surface Temperature [Night]](/images/datasets/132x66/MOD_LSTN_M.jpg)


NEO News
New Dataset: Global Temperature Anomaly
April 11th, 2011 by Kevin Ward
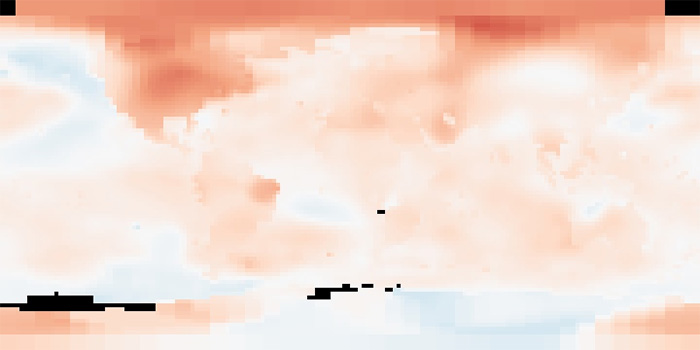
These maps depict how much warmer or colder a region may be in a given month compared to the norm for that same month in the same region from 1951-1980. These maps do not depict absolute temperature but instead show temperature anomalies, or how much it has changed. These data currently include annual and monthly composites from January 1880 to present.
View the complete collection and read more about global temperature anomaly on NEO.
Comments Off on New Dataset: Global Temperature Anomaly
- Browse by Topic
- Analysis
- NEO in the Media
- New Datasets
- Services
- Uncategorized
- Browse by Date
- June 2026
- July 2025
- August 2024
- May 2023
- April 2021
- February 2021
- December 2020
- November 2020
- October 2020
- September 2020
- June 2019
- March 2019
- April 2015
- April 2014
- December 2013
- November 2013
- August 2013
- March 2013
- June 2012
- June 2011
- April 2011
- November 2010
- August 2010
- February 2009
- May 2008
- April 2007