


![Average Land Surface Temperature [Day]](/images/datasets/132x66/MOD_LSTD_CLIM_M.jpg)
![Average Land Surface Temperature [Night]](/images/datasets/132x66/MOD_LSTN_CLIM_M.jpg)


![Land Surface Temperature Anomaly [Day]](/images/datasets/132x66/MOD_LSTAD_M.jpg)
![Land Surface Temperature Anomaly [Night]](/images/datasets/132x66/MOD_LSTAN_M.jpg)
![Land Surface Temperature [Day]](/images/datasets/132x66/MOD_LSTD_M.jpg)
![Land Surface Temperature [Night]](/images/datasets/132x66/MOD_LSTN_M.jpg)


NEO News
New Datasets: Average Land Surface Temperature and Anomaly
February 19th, 2009 by Kevin Ward
We have four new datasets that have just been added to the collection:

Land surface temperature is how hot the ground feels to the touch. If you want to know whether temperatures at some place at a specific time of year are unusually warm or cold, you need to compare them to the average temperatures for that place over many years. These maps show the average weekly or monthly, daytime or nighttime land surface temperatures for 2001-2010.
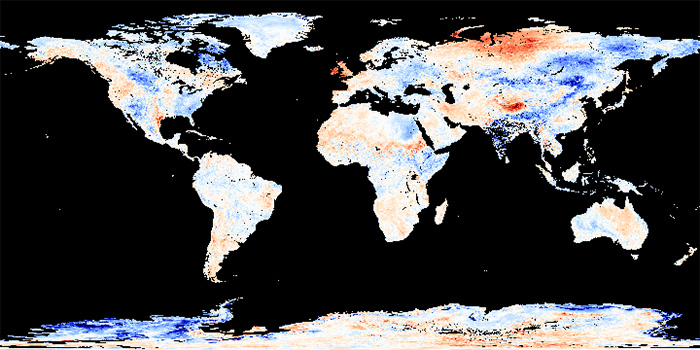
An anomaly is when something is different from average. These anomaly maps show where Earth’s surface was warmer or cooler during the day or night than the average temperatures for the same week or month from 2001-2010. For example, a daytime land surface temperature anomaly map for May 2002 would show how that month’s daytime temperature was different from the average temperature for all Mays between 2001 and 2010.
Comments Off on New Datasets: Average Land Surface Temperature and Anomaly
- Browse by Topic
- Analysis
- NEO in the Media
- New Datasets
- Services
- Uncategorized
- Browse by Date
- June 2026
- July 2025
- August 2024
- May 2023
- April 2021
- February 2021
- December 2020
- November 2020
- October 2020
- September 2020
- June 2019
- March 2019
- April 2015
- April 2014
- December 2013
- November 2013
- August 2013
- March 2013
- June 2012
- June 2011
- April 2011
- November 2010
- August 2010
- February 2009
- May 2008
- April 2007