


![Average Land Surface Temperature [Day]](/images/datasets/132x66/MOD_LSTD_CLIM_M.jpg)
![Average Land Surface Temperature [Night]](/images/datasets/132x66/MOD_LSTN_CLIM_M.jpg)


![Land Surface Temperature Anomaly [Day]](/images/datasets/132x66/MOD_LSTAD_M.jpg)
![Land Surface Temperature Anomaly [Night]](/images/datasets/132x66/MOD_LSTAN_M.jpg)
![Land Surface Temperature [Day]](/images/datasets/132x66/MOD_LSTD_M.jpg)
![Land Surface Temperature [Night]](/images/datasets/132x66/MOD_LSTN_M.jpg)


NEO News
How To Add Country Labels to Your NEO Image
April 19th, 2021 by Andi Thomas
We recently received an email about adding country labels to a NEO image to better understand where certain data points are in the world. Here is one way to add labels to any NEO image in QGIS.
QGIS is a free and open-source Geographic Information System. If you do not have QGIS on your machine, there are copies available for download here: https://qgis.org/en/site/forusers/download.html.
Then, follow this blog to add NEO layers to your map via WMS in QGIS: https://neo.gsfc.nasa.gov/blog/2021/02/08/how-to-add-neo-layers-to-your-map-using-the-neo-web-mapping-service/.
We are now ready to add country labels to your NEO layer of choice. For this example, I am going to use the Nitrogen Dioxide (1 month) dataset.
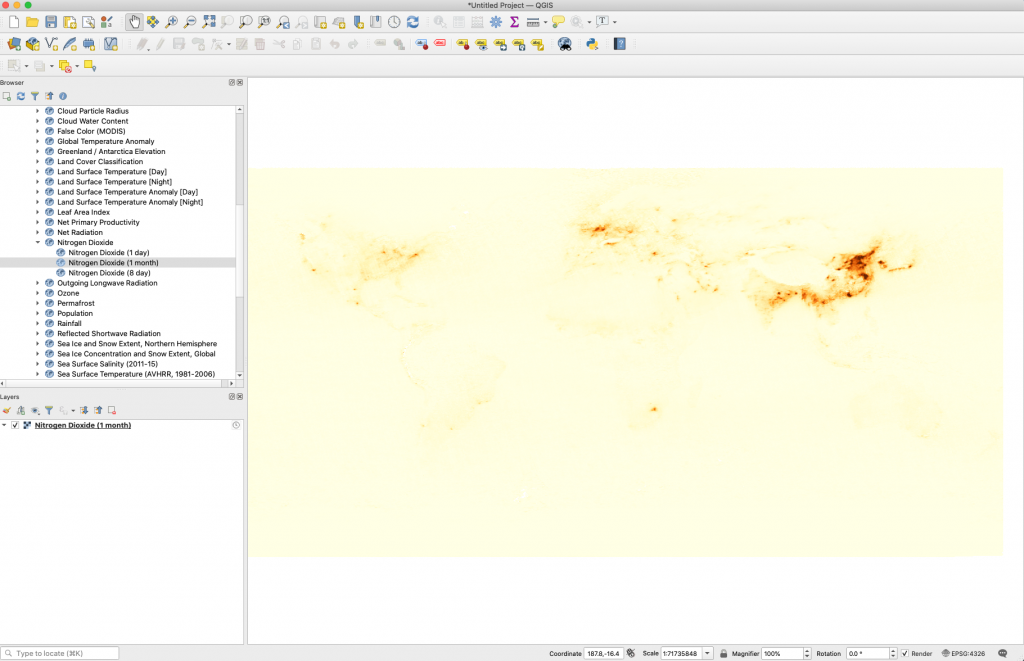
There are several datasets available for free that provide the country border and label for the world. I keep one handy in my directory that was created by Bjorn Sandvik at thematicmapping.org. Download your own copy here: https://thematicmapping.org/downloads/world_borders.php. Once you have downloaded and saved the file somewhere on your machine, unzip the file and drag and drop the TM_WORLD_BORDERS-0.3.shp into your QGIS window.
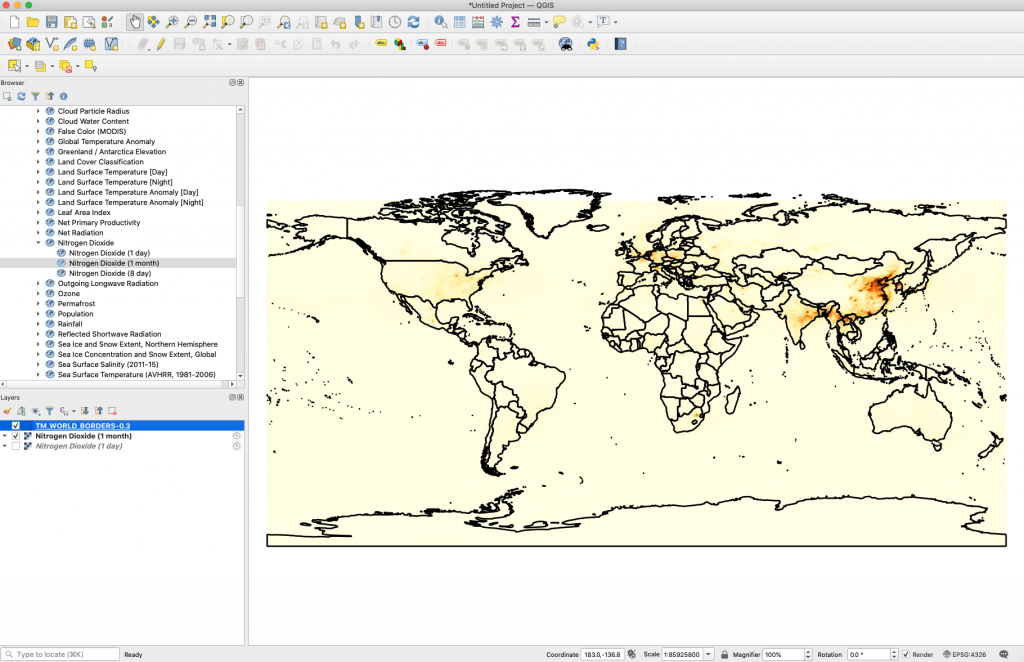
Now it is time to add labels.
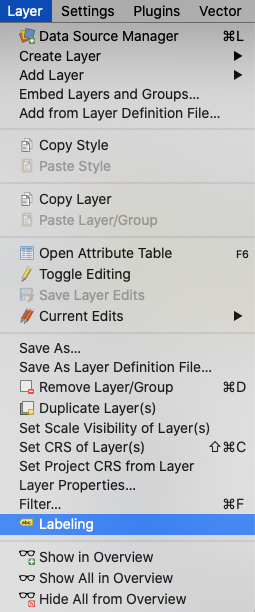
Go to Layer > Select Labeling and add Single Labels from the drop down in the Layer Styling window that pops up.
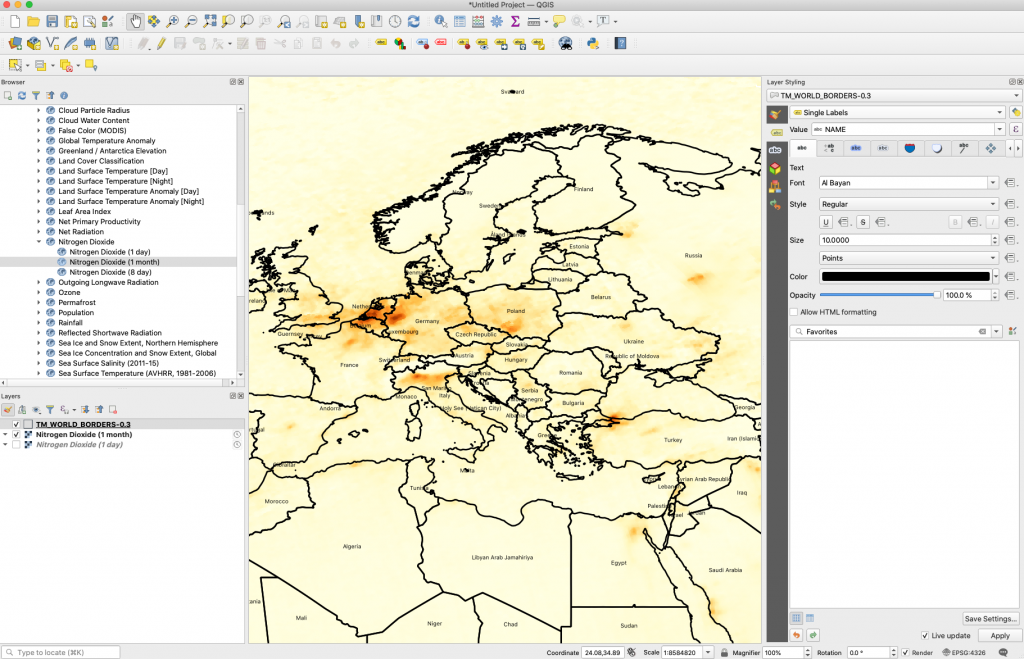
The map may not have the aesthetic you need to see the labels clearly. The color and font of the labels can be changed in the Layer Styling window. The color of the countries shapefile can be changed by double-clicking on the box next to the shapefile label in the Layers window.
If the labels do not provide the granularity needed for each country, try adding one of these shapefiles from the Centers for Disease Control and Prevention to your map using the same process: https://www.cdc.gov/epiinfo/support/downloads/shapefiles.html.
This blog has a few tips on choosing the right map color: https://neo.gsfc.nasa.gov/blog/2020/10/16/create-and-apply-the-right-color-palette-in-adobe-photoshop-for-your-map-visualization-part-1-of-3/.
Feel free to add any questions or tutorial suggestions in the comments below.
Comments Off on How To Add Country Labels to Your NEO Image
- Browse by Topic
- Analysis
- NEO in the Media
- New Datasets
- Services
- Uncategorized
- Browse by Date
- June 2026
- July 2025
- August 2024
- May 2023
- April 2021
- February 2021
- December 2020
- November 2020
- October 2020
- September 2020
- June 2019
- March 2019
- April 2015
- April 2014
- December 2013
- November 2013
- August 2013
- March 2013
- June 2012
- June 2011
- April 2011
- November 2010
- August 2010
- February 2009
- May 2008
- April 2007