


![Average Land Surface Temperature [Day]](/images/datasets/132x66/MOD_LSTD_CLIM_M.jpg)
![Average Land Surface Temperature [Night]](/images/datasets/132x66/MOD_LSTN_CLIM_M.jpg)


![Land Surface Temperature Anomaly [Day]](/images/datasets/132x66/MOD_LSTAD_M.jpg)
![Land Surface Temperature Anomaly [Night]](/images/datasets/132x66/MOD_LSTAN_M.jpg)
![Land Surface Temperature [Day]](/images/datasets/132x66/MOD_LSTD_M.jpg)
![Land Surface Temperature [Night]](/images/datasets/132x66/MOD_LSTN_M.jpg)


NEO News
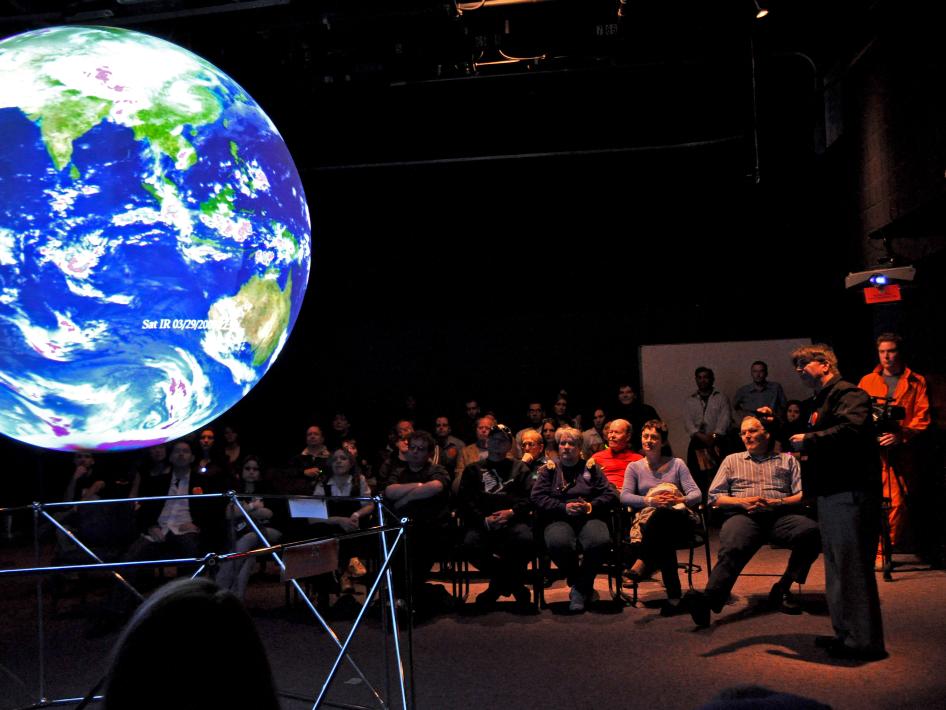
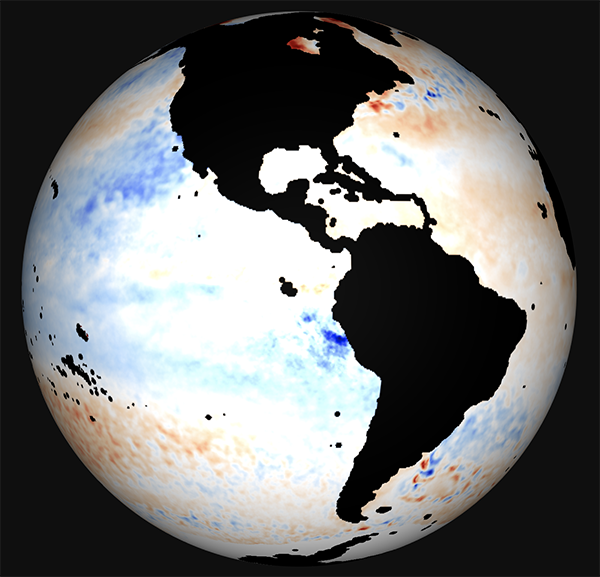
View NEO Imagery on a Sphere
November 23rd, 2020 by Andi Thomas
There are several companies and organizations that provide spherical projector technology, but the first one I had ever heard of was Science on a Sphere (SOS) created by the National Oceanic and Atmospheric Administration (NOAA). Originally envisioned in 1995 by Dr. Alexander “Sandy” MacDonald and later patented in 2005, these Science on a Spheres (and other variations) are in hundreds of locations across the United States and abroad to help increase understanding of Earth’s complex processes.
In support of these visualization systems, NEO provides an archive of time-lapse global imagery to display in spherical projections located in the NEO SOS Archive. NEO uses the Content Creation Guidelines by NOAA to provide a time series in the preferred projection, image format, and resolution. There is also a labels.txt file available with each dataset to label the images with the correct acquisition, a color bar file to provide context to each time series, and a PIP text file (.SOS) that points to the labels and color bar file along with extra features like fade in time and frame rate. Please see the SOS Remote App manual to learn how to display NEO’s time-series datasets on your display system using the SOS Remote App.
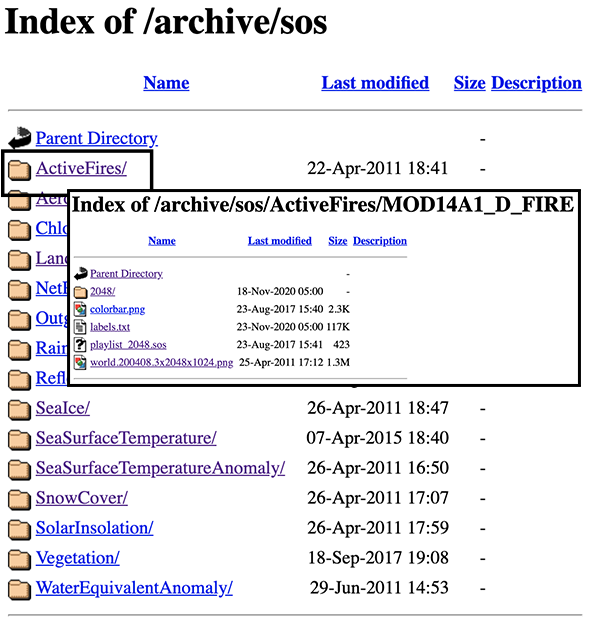
This service started based on requests and only has part of the NEO archive available. If you see a dataset that is not in the archive on our site and you would like it for your spherical visualization, please send us an email using the Contact Us link below.
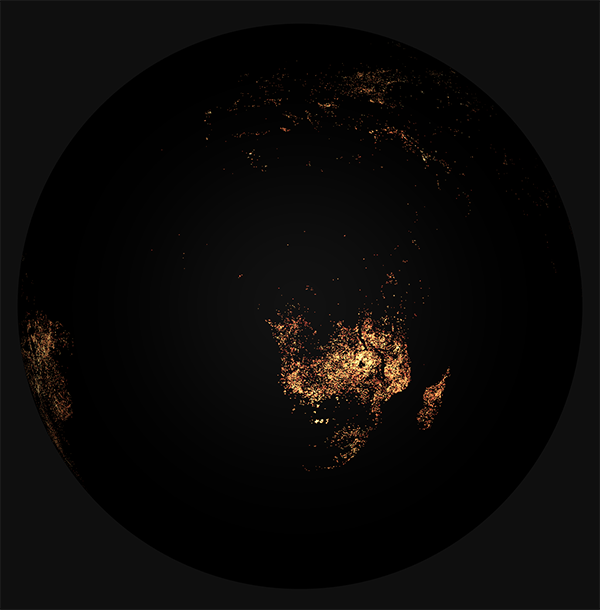
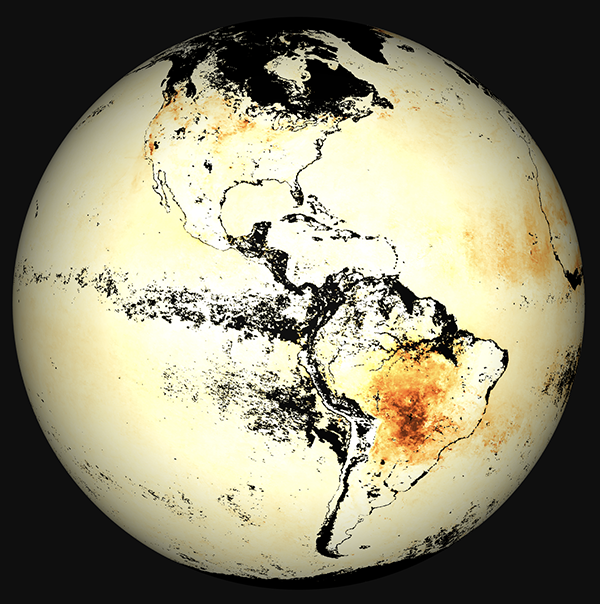
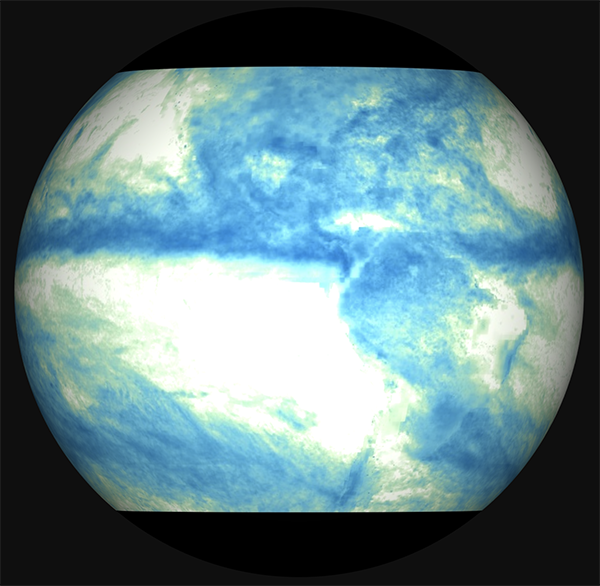
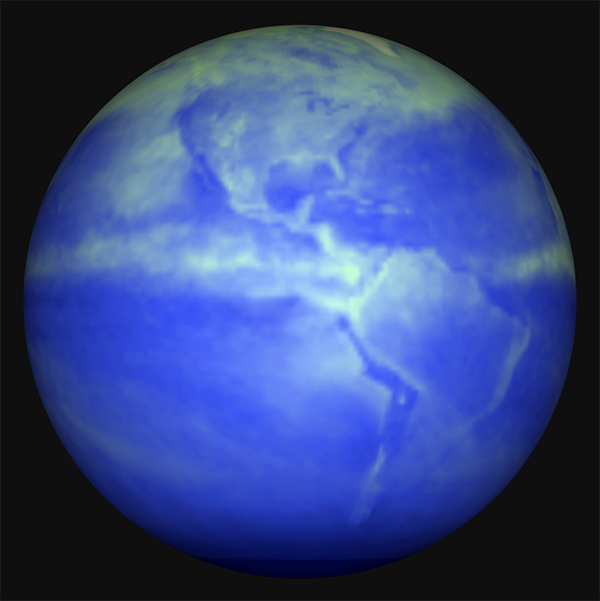
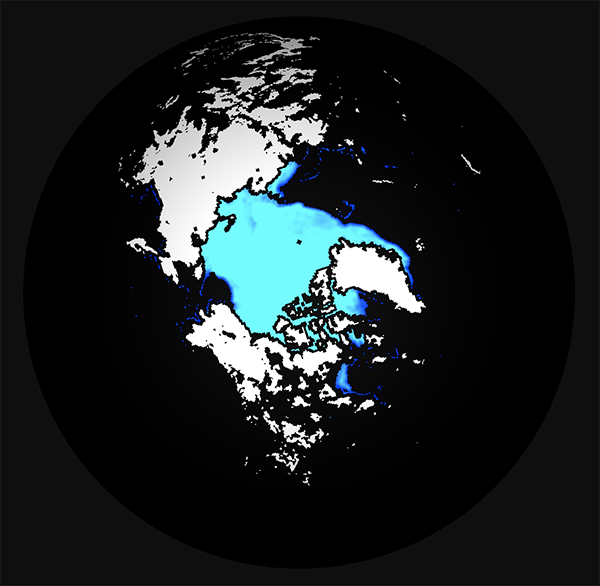
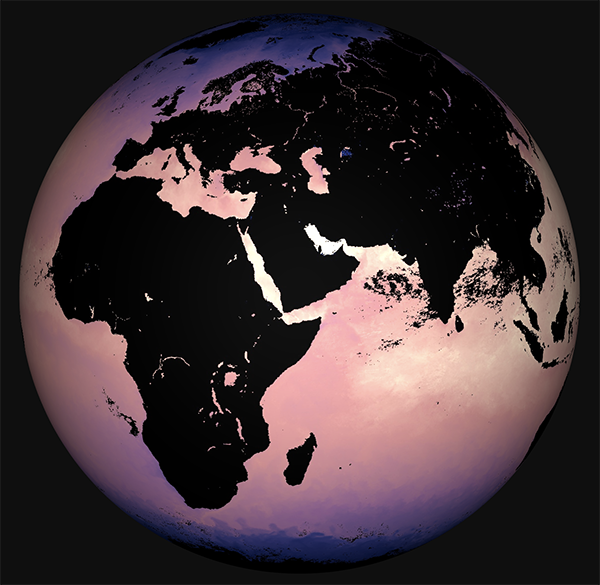
Here is a preview of some of the datasets we currently have available in the SOS Archive:
Active Fires from Terra/ MODIS
Aerosol Optical Thickness (Depth) from Terra/ MODIS
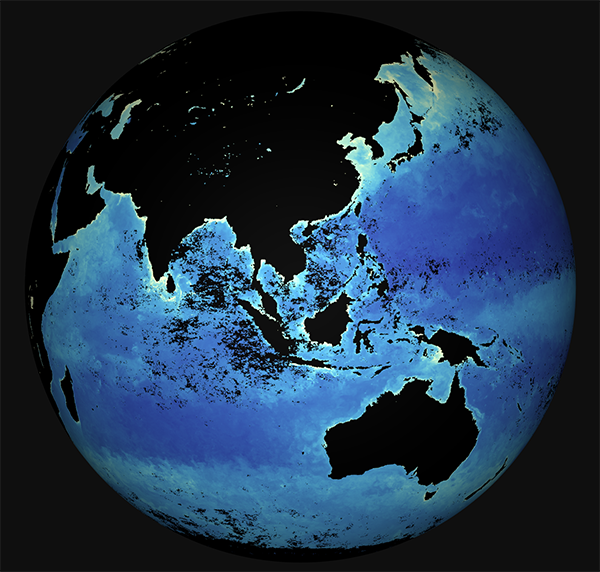
Chlorophyll Concentration from Aqua/ MODIS
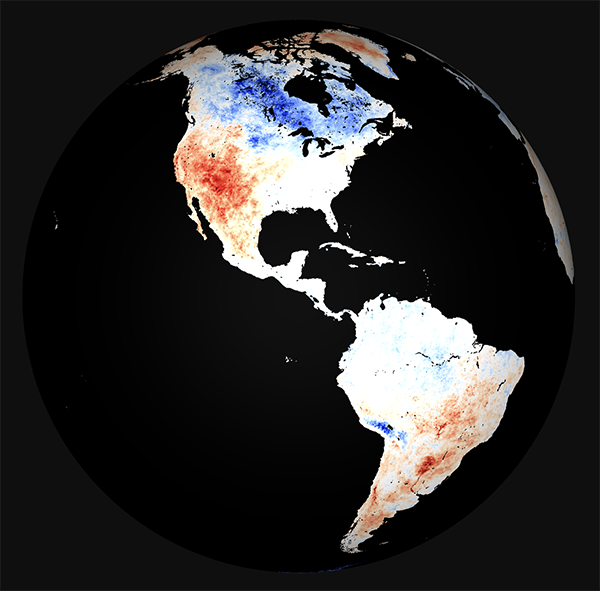
Land Surface Temperature Anomaly (Day) from MODIS
Net Radiation from CERES
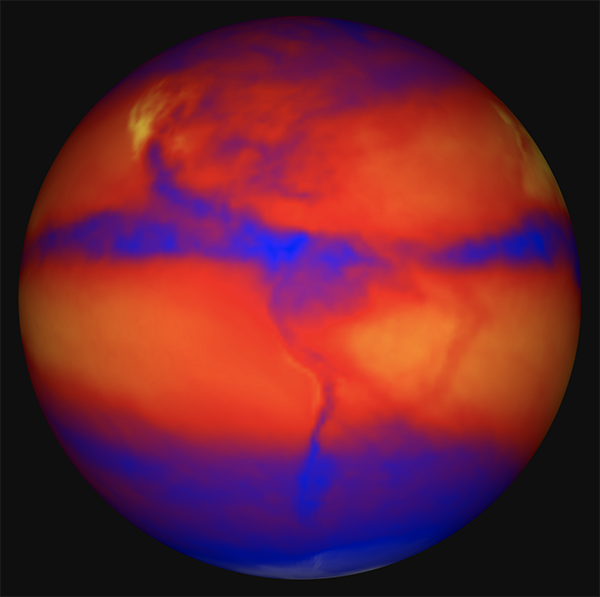
Outgoing Longwave Radiation from CERES
Rainfall from TRMM
Reflected Shortwave Radiation from CERES
Sea Ice Concentration from SSM/I / DMSP
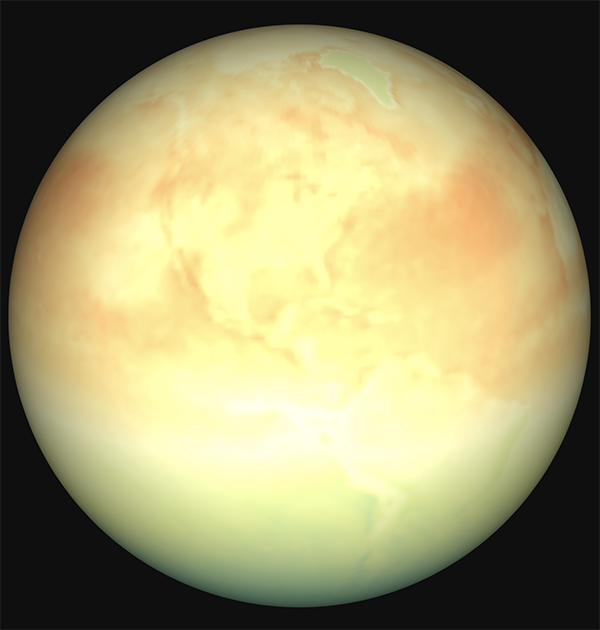
Sea Surface Temperature from Aqua/ MODIS
Sea Surface Temperature Anomaly from AQUA/AMSR-E
Comments Off on View NEO Imagery on a Sphere
- Browse by Topic
- Analysis
- NEO in the Media
- New Datasets
- Services
- Uncategorized
- Browse by Date
- June 2026
- July 2025
- August 2024
- May 2023
- April 2021
- February 2021
- December 2020
- November 2020
- October 2020
- September 2020
- June 2019
- March 2019
- April 2015
- April 2014
- December 2013
- November 2013
- August 2013
- March 2013
- June 2012
- June 2011
- April 2011
- November 2010
- August 2010
- February 2009
- May 2008
- April 2007