


![Average Land Surface Temperature [Day]](/images/datasets/132x66/MOD_LSTD_CLIM_M.jpg)
![Average Land Surface Temperature [Night]](/images/datasets/132x66/MOD_LSTN_CLIM_M.jpg)


![Land Surface Temperature Anomaly [Day]](/images/datasets/132x66/MOD_LSTAD_M.jpg)
![Land Surface Temperature Anomaly [Night]](/images/datasets/132x66/MOD_LSTAN_M.jpg)
![Land Surface Temperature [Day]](/images/datasets/132x66/MOD_LSTD_M.jpg)
![Land Surface Temperature [Night]](/images/datasets/132x66/MOD_LSTN_M.jpg)


NEO News
TRMM Rainfall Dataset Removed
July 18th, 2025 by Kevin Ward
With the complete reprocessing of the GPM IMERG rainfall dataset that includes the full TRMM rainfall record back to 1998, it is no longer necessary to maintain both of these datasets. Please use the GPM IMERG dataset for your rainfall imagery needs.
Comments Off on TRMM Rainfall Dataset Removed
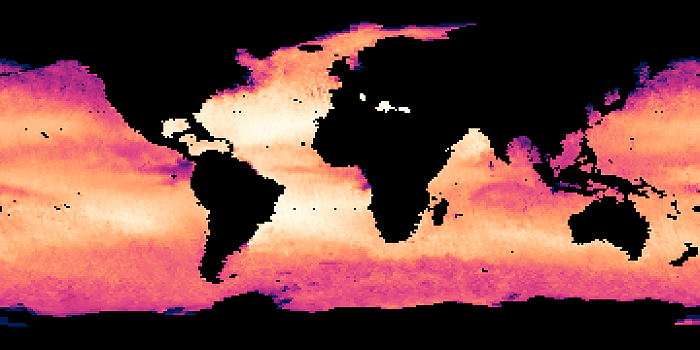
New Dataset: Sea Surface Temperature 1998+ (1 day MWOI)
April 6th, 2015 by Kevin Ward
We have just added a new sea surface temperature dataset to replace the similar data from the defunct AMSR-E instrument aboard NASA’s Aqua satellite. This replacement dataset is a composite from multiple microwave-based sensors (also including AMSR-E) but includes a longer temporal span, beginning in 1998 and continuing to the present.
Read more about this dataset and download imagery on NEO.
Special thanks go out to Remote Sensing Systems for their assistance.
Comments Off on New Dataset: Sea Surface Temperature 1998+ (1 day MWOI)
New Dataset: UV Index
April 30th, 2014 by Kevin Ward
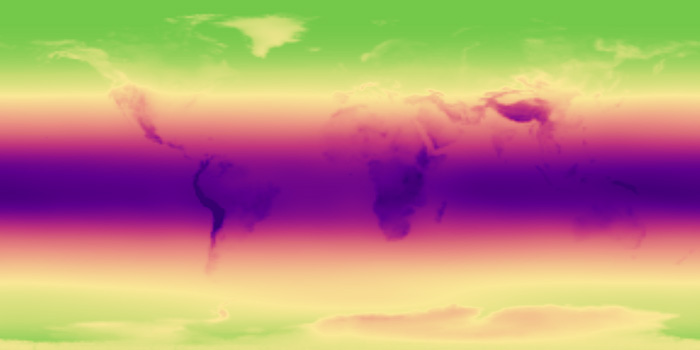
The UV Index is a measure of the intensity of ultraviolet (UV) rays from the Sun. Some exposure to the Sun’s rays is beneficial as it helps our bodies produce vitamin D. But too much exposure to UV rays can have harmful effects. In the short-term, skin exposed to UV rays can burn. A ‘sunburn’ can happen within minutes or over the course of several hours. Over the long term, UV exposure can result in premature aging, skin cancer, and damage to your eyes.
These climatology maps are produced using data collected between October 2004 and January 2011 from the Ozone Monitoring Instrument (OMI) onboard the Aura satellite.
View all the images and read more about this dataset on NEO.
Comments Off on New Dataset: UV Index
New Dataset: Nitrogen Dioxide
November 20th, 2013 by Kevin Ward
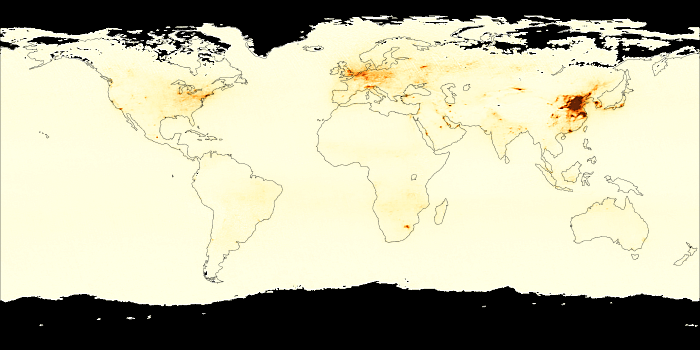
Nitrogen dioxide (NO2) is a gas that occurs naturally in our atmosphere. NO2 plays an important role in the formation of ozone in the air we breathe. Ozone high in the atmosphere helps us. It is like sunscreen, and it protects us from harmful ultraviolet (UV) rays from the Sun. Near the ground though, ozone is a pollutant. It damages our lungs and harms plants, including the plants we eat. Ozone occurs naturally in the air we breathe, but there’s not enough of it to hurt us. Unhealthy levels of ozone form when there is a lot of NO2 in the air. NO2—and ozone—concentrations are usually highest in cities, since NO2 is released into the atmosphere when we burn gas in our cars or coal in our power plants, both things that happen more in cities. Ozone pollution is worse in summer. NO2 is also unhealthy to breathe in high concentrations, such as on busy streets and highways where there are lots of cars and trucks. When driving, it is typically a good idea to keep the car windows rolled up and the car's ventilation set to “recirculate” so as to keep pollution out of the interior of the car. It is also important to reduce outdoor activities like playing or jogging if government officials warn you that air quality will be bad on a certain day.
These maps are produced using data from The Ozone Monitoring Instrument (OMI), on board NASA's Aura satellite and are available in daily, weekly, and monthly composites from October 2004 to the present.
View all the images and read more about this dataset on NEO.
Comments Off on New Dataset: Nitrogen Dioxide
New Dataset: Sea Surface Salinity
August 21st, 2013 by Kevin Ward
The ocean’s salinity is key to studying the water cycle and ocean circulation, both of which are important to Earth’s climate. Differences in salinity play a major role in moving seawater around the globe. Below the wind-blown ocean surface, salinity and temperature drive circulation by controlling the “density” (mass per unit volume) of seawater. The weight of dissolved salt increases water’s density and when salinities are equal, colder water is denser than warmer water. In addition to moving salt and water, density-driven circulation is crucial to moving heat around our planet. The movement of heat by our ocean—for example, from the equator to the poles—is crucial to keeping Earth’s climate “just right.”
These maps are produced using data from the Aquarius instrument onboard the AQUARIUS/SAC-D satellite, a collaborative effort between NASA and the Argentinian Space Agency Comision Nacional de Actividades Espaciales (CONAE) and are available in NEO in weekly and monthly composites.
View all the images and read more about this dataset on NEO.
Comments Off on New Dataset: Sea Surface Salinity
New Dataset: Ozone
June 12th, 2012 by Kevin Ward

The Ozone Monitoring Instrument (OMI) on NASA’s Aura satellite provides measurements of total column ozone, which is how much ozone is present in a column of the atmosphere stretching from the surface to the top of the atmosphere. Therefore, it includes both ground-level and stratospheric ozone. Ground-level ozone is especially common in industrialized areas during the summertime, and winds can blow ozone from urban areas into neighboring areas. Stratospheric ozone, however, absorbs harmful ultraviolet radiation known as UV-B. Because of stratospheric ozone’s protective function, the “ozone hole” over Earth’s southern polar region has concerned scientists since the late 1970s.
NEO now provides daily, weekly, and monthly composites of total column ozone from October 2004 to present.
View the complete collection and read more about ozone on NEO.
Comments Off on New Dataset: Ozone
New Dataset: Water Equivalent Anomaly
June 29th, 2011 by Kevin Ward
These maps show how water stored on and in the land changes from month to month. The maps are blue where there is more water than average and red where there is less water. Water accumulates on land in rivers and lakes, as ground water and soil moisture, and as snow and ice. Scientists track water both to understand the water cycle and to monitor the availability of fresh water. The maps show that water levels change throughout the year with the seasons. Changes from year to year may reveal drought or an excess of water. These data currently include monthly composites from April 2002 to present.
View the complete collection and read more about water equivalent anomaly on NEO.
Comments Off on New Dataset: Water Equivalent Anomaly
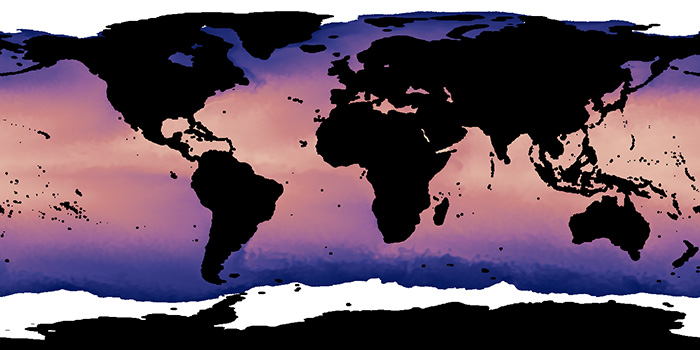
New Dataset: Global Temperature Anomaly
April 11th, 2011 by Kevin Ward
These maps depict how much warmer or colder a region may be in a given month compared to the norm for that same month in the same region from 1951-1980. These maps do not depict absolute temperature but instead show temperature anomalies, or how much it has changed. These data currently include annual and monthly composites from January 1880 to present.
View the complete collection and read more about global temperature anomaly on NEO.
Comments Off on New Dataset: Global Temperature Anomaly
New Dataset: Sea Surface Temperature 1981-2006 (AVHRR)
August 4th, 2010 by Kevin Ward

Sea surface temperature is the temperature of the top millimeter of the ocean’s surface. Sea surface temperatures influence weather, including hurricanes, as well as plant and animal life in the ocean. Like Earth’s land surface, sea surface temperatures are warmer near the equator and colder near the poles. Currents like giant rivers move warm and cold water around the world’s oceans. Some of these currents flow on the surface, and they are obvious in sea surface temperature images. These data are collected by an ongoing series of National Oceanic and Atmospheric Administration (NOAA) satellites as part of the NOAA/NASA Advanced Very High Resolution Radiometer (AVHRR) Pathfinder Program.
View the complete collection and read more about this dataset on NEO.
Comments Off on New Dataset: Sea Surface Temperature 1981-2006 (AVHRR)
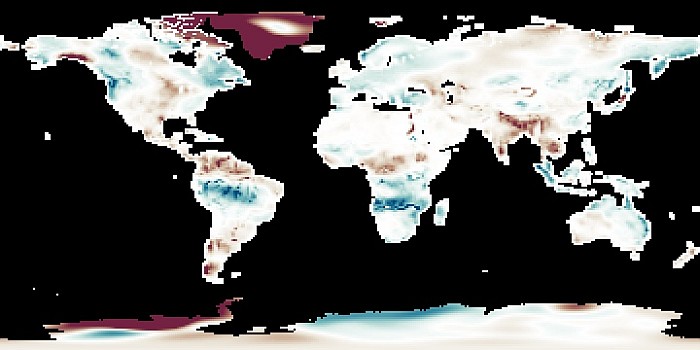
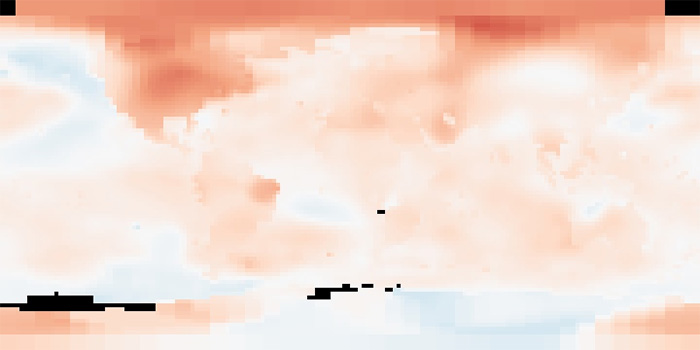
New Datasets: Average Land Surface Temperature and Anomaly
February 19th, 2009 by Kevin Ward
We have four new datasets that have just been added to the collection:
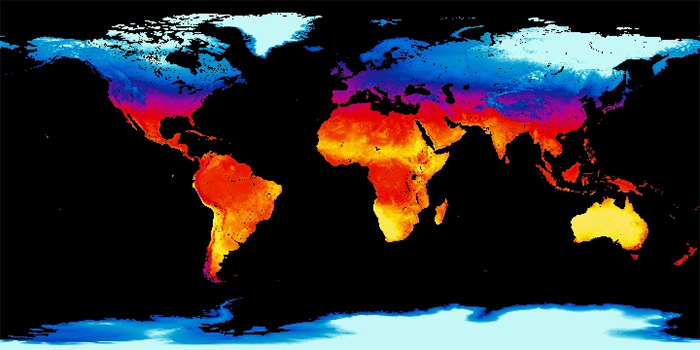
Land surface temperature is how hot the ground feels to the touch. If you want to know whether temperatures at some place at a specific time of year are unusually warm or cold, you need to compare them to the average temperatures for that place over many years. These maps show the average weekly or monthly, daytime or nighttime land surface temperatures for 2001-2010.
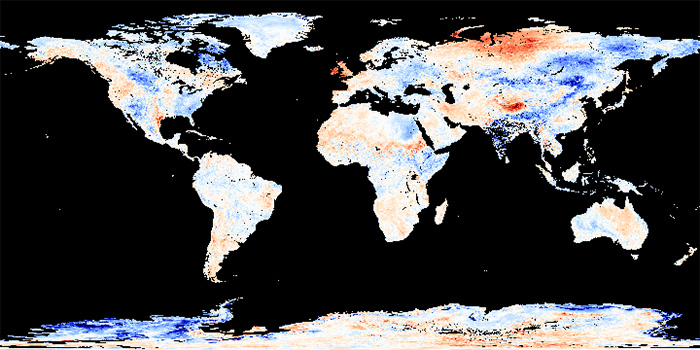
An anomaly is when something is different from average. These anomaly maps show where Earth’s surface was warmer or cooler during the day or night than the average temperatures for the same week or month from 2001-2010. For example, a daytime land surface temperature anomaly map for May 2002 would show how that month’s daytime temperature was different from the average temperature for all Mays between 2001 and 2010.
Comments Off on New Datasets: Average Land Surface Temperature and Anomaly
- Browse by Topic
- Analysis
- NEO in the Media
- New Datasets
- Services
- Uncategorized
- Browse by Date
- June 2026
- July 2025
- August 2024
- May 2023
- April 2021
- February 2021
- December 2020
- November 2020
- October 2020
- September 2020
- June 2019
- March 2019
- April 2015
- April 2014
- December 2013
- November 2013
- August 2013
- March 2013
- June 2012
- June 2011
- April 2011
- November 2010
- August 2010
- February 2009
- May 2008
- April 2007