


![Average Land Surface Temperature [Day]](/images/datasets/132x66/MOD_LSTD_CLIM_M.jpg)
![Average Land Surface Temperature [Night]](/images/datasets/132x66/MOD_LSTN_CLIM_M.jpg)


![Land Surface Temperature Anomaly [Day]](/images/datasets/132x66/MOD_LSTAD_M.jpg)
![Land Surface Temperature Anomaly [Night]](/images/datasets/132x66/MOD_LSTAN_M.jpg)
![Land Surface Temperature [Day]](/images/datasets/132x66/MOD_LSTD_M.jpg)
![Land Surface Temperature [Night]](/images/datasets/132x66/MOD_LSTN_M.jpg)


NEO News
Welcome to new NEO!
August 19th, 2013 by Kevin Ward
If you have been a user of NEO in the past you will, no doubt, notice many changes to the website. After many years (nearly 8!) we finally have a new look and have made several improvements to the navigation and functionality. That being said, much of the flow of the site is relatively unchanged. So let’s take a look at a couple redesigned elements of the dataset view page, which is one of the main functions of the site. (See this example for the full view.)
Starting below the main image, you will see the ability to toggle between different variations of the dataset. These variations will differ depending on which dataset you are viewing and for many the “View by satellite” toggle will not be relevant. Clicking on any of these buttons will both change the image above and the calendar view below.

Image download options
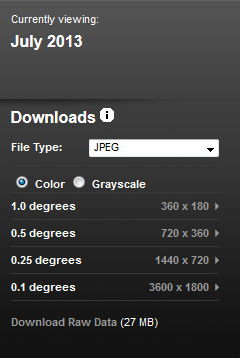
Currently viewing: At the top of the download options block you will see the date of the image you are currently viewing. The date may be either a year, a month + year, a single day, or a date range, depending upon what dataset you are viewing.
Downloads: This is where you can choose the format, size, and color of the image you would like to download. Select the desired file type from the list (for more information about the types of files that are available, click on the “i” help button next to “Downloads”), whether you want the image in color, as you see it on the page, or in grayscale, which can be useful for applying your own color palettes. Once you have made those selections, click on the dimensions you want (e.g., 360 x 180) and you can download the image.
Download Raw Data: If the source data file for this particular dataset is available online there will be a direct link to it here. These files can be in a variety of formats and are hosted by various data providers, not by NEO. We can help point you to the data owners if you have questions but otherwise we cannot provide support for these types of data.
Calendar view
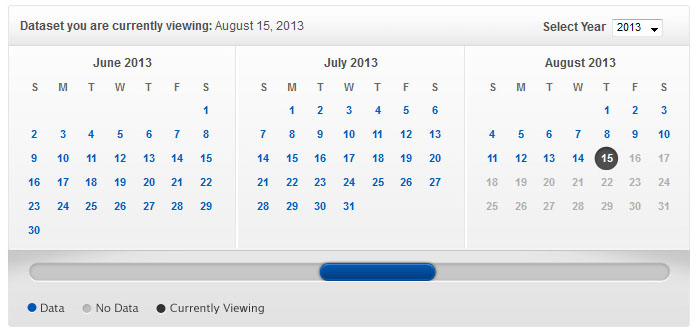
Depending upon the dataset you are viewing, you will see one of three different types of calendar views on the page (the daily view is shown below). Use the blue slider to navigate between the time periods in the given year and the “Select Year” drop-down just above the calendars to change the year. Blue links will change the image shown when clicked. The calendar menus greatly improve your ability to browse the entire collection by date. The old way was a nightmare, I know; thank you all for your patience.
We hope that you like the new look of NEO and if you have any questions about the site please be sure to leave us a comment here or get in touch through our contact form.
Comments Off on Welcome to new NEO!
Washington Post Snow Cover Visualization
March 6th, 2013 by Kevin Ward
The Washington Post featured imagery from NEO as part of their visualization illustrating changes in snow cover since 2010.
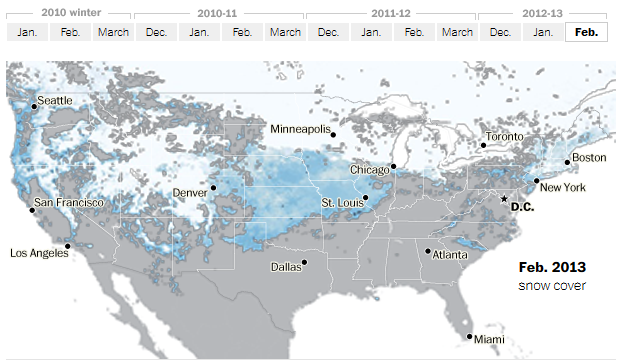
View Timelapse: A look at where snow has fallen at the Washington Post.
Comments Off on Washington Post Snow Cover Visualization
New Dataset: Ozone
June 12th, 2012 by Kevin Ward
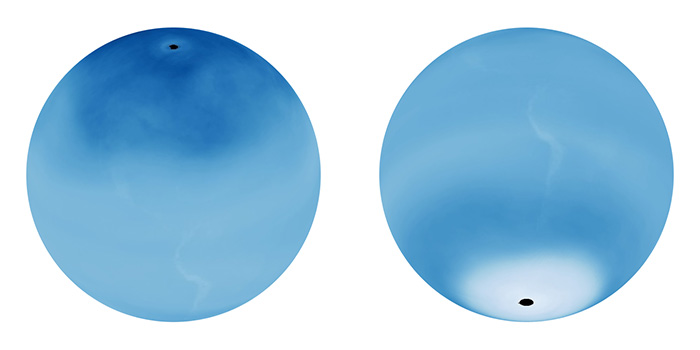
The Ozone Monitoring Instrument (OMI) on NASA’s Aura satellite provides measurements of total column ozone, which is how much ozone is present in a column of the atmosphere stretching from the surface to the top of the atmosphere. Therefore, it includes both ground-level and stratospheric ozone. Ground-level ozone is especially common in industrialized areas during the summertime, and winds can blow ozone from urban areas into neighboring areas. Stratospheric ozone, however, absorbs harmful ultraviolet radiation known as UV-B. Because of stratospheric ozone’s protective function, the “ozone hole” over Earth’s southern polar region has concerned scientists since the late 1970s.
NEO now provides daily, weekly, and monthly composites of total column ozone from October 2004 to present.
View the complete collection and read more about ozone on NEO.
Comments Off on New Dataset: Ozone
New Dataset: Water Equivalent Anomaly
June 29th, 2011 by Kevin Ward
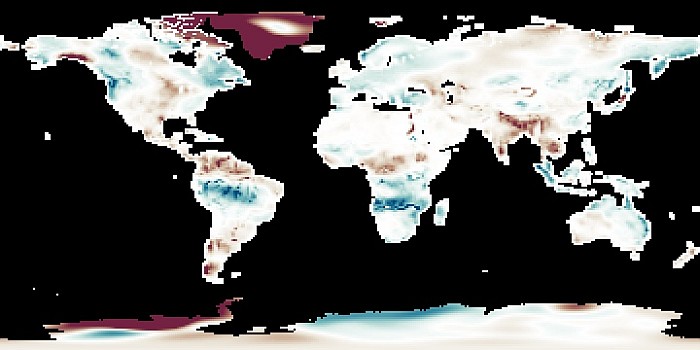
These maps show how water stored on and in the land changes from month to month. The maps are blue where there is more water than average and red where there is less water. Water accumulates on land in rivers and lakes, as ground water and soil moisture, and as snow and ice. Scientists track water both to understand the water cycle and to monitor the availability of fresh water. The maps show that water levels change throughout the year with the seasons. Changes from year to year may reveal drought or an excess of water. These data currently include monthly composites from April 2002 to present.
View the complete collection and read more about water equivalent anomaly on NEO.
Comments Off on New Dataset: Water Equivalent Anomaly
New Dataset: Global Temperature Anomaly
April 11th, 2011 by Kevin Ward
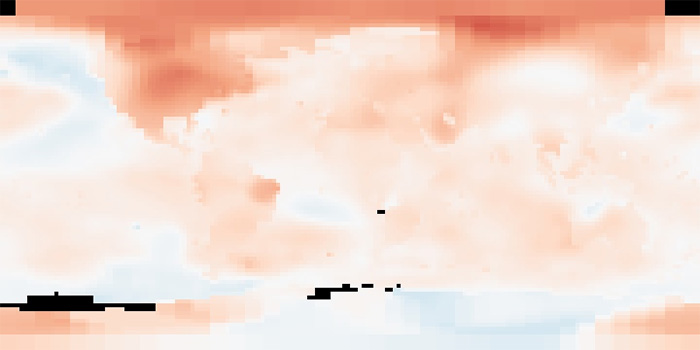
These maps depict how much warmer or colder a region may be in a given month compared to the norm for that same month in the same region from 1951-1980. These maps do not depict absolute temperature but instead show temperature anomalies, or how much it has changed. These data currently include annual and monthly composites from January 1880 to present.
View the complete collection and read more about global temperature anomaly on NEO.
Comments Off on New Dataset: Global Temperature Anomaly
Exploring the Role of Snow Cover in Shaping Climate with NEO
November 12th, 2010 by Kevin Ward
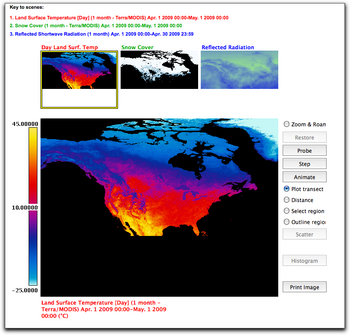
In this chapter from the Earth Exploration Toolbook, you can investigate satellite images displaying land surface temperature, snow cover, and reflected shortwave radiation data from NEO.
Download, explore, and animate these images using ImageJ, a public domain image analysis program from the National Institutes of Health (NIH). Then use the web-based analysis tools built into NEO to observe, graph, and analyze the relationship between the three variables.
Comments Off on Exploring the Role of Snow Cover in Shaping Climate with NEO
NEO is now on Facebook
November 10th, 2010 by Kevin Ward
Now you can also follow the action on Facebook! Hope to see you there: https://www.facebook.com/NASAEarthObservations
Comments Off on NEO is now on Facebook
New Dataset: Sea Surface Temperature 1981-2006 (AVHRR)
August 4th, 2010 by Kevin Ward

Sea surface temperature is the temperature of the top millimeter of the ocean’s surface. Sea surface temperatures influence weather, including hurricanes, as well as plant and animal life in the ocean. Like Earth’s land surface, sea surface temperatures are warmer near the equator and colder near the poles. Currents like giant rivers move warm and cold water around the world’s oceans. Some of these currents flow on the surface, and they are obvious in sea surface temperature images. These data are collected by an ongoing series of National Oceanic and Atmospheric Administration (NOAA) satellites as part of the NOAA/NASA Advanced Very High Resolution Radiometer (AVHRR) Pathfinder Program.
View the complete collection and read more about this dataset on NEO.
Comments Off on New Dataset: Sea Surface Temperature 1981-2006 (AVHRR)
New Datasets: Average Land Surface Temperature and Anomaly
February 19th, 2009 by Kevin Ward
We have four new datasets that have just been added to the collection:
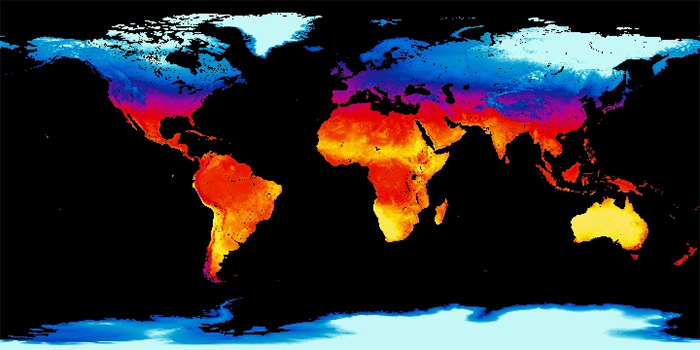
Land surface temperature is how hot the ground feels to the touch. If you want to know whether temperatures at some place at a specific time of year are unusually warm or cold, you need to compare them to the average temperatures for that place over many years. These maps show the average weekly or monthly, daytime or nighttime land surface temperatures for 2001-2010.
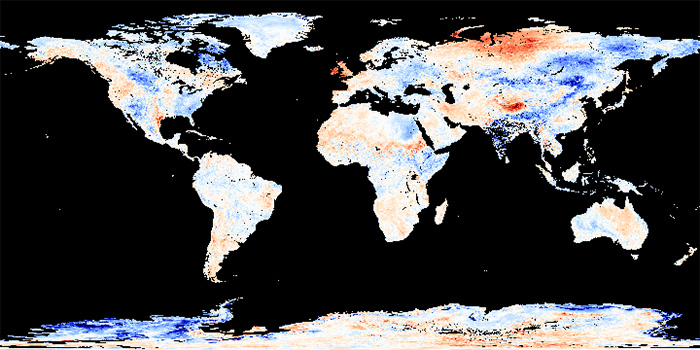
An anomaly is when something is different from average. These anomaly maps show where Earth’s surface was warmer or cooler during the day or night than the average temperatures for the same week or month from 2001-2010. For example, a daytime land surface temperature anomaly map for May 2002 would show how that month’s daytime temperature was different from the average temperature for all Mays between 2001 and 2010.
Comments Off on New Datasets: Average Land Surface Temperature and Anomaly
New Dataset: Solar Insolation
May 30th, 2008 by Kevin Ward

These maps show where and how much sunlight fell on Earth’s surface during the time period indicated. Scientists call this measure solar insolation. Knowing how much of the Sun’s energy reaches the surface helps scientists understand weather and climate patterns as well as patterns of plant growth around our world. Solar insolation maps are also useful to engineers who design solar panels and batteries designed to convert energy from the Sun into electricity to power appliances in our homes and work places.
NEO now provides daily, weekly, and monthly composites of total column ozone from July 2006 to present.
View the complete collection and read more about global temperature anomaly on NEO.
Comments Off on New Dataset: Solar Insolation
- Browse by Topic
- Analysis
- NEO in the Media
- New Datasets
- Services
- Uncategorized
- Browse by Date
- June 2026
- July 2025
- August 2024
- May 2023
- April 2021
- February 2021
- December 2020
- November 2020
- October 2020
- September 2020
- June 2019
- March 2019
- April 2015
- April 2014
- December 2013
- November 2013
- August 2013
- March 2013
- June 2012
- June 2011
- April 2011
- November 2010
- August 2010
- February 2009
- May 2008
- April 2007