


![Average Land Surface Temperature [Day]](/images/datasets/132x66/MOD_LSTD_CLIM_M.jpg)
![Average Land Surface Temperature [Night]](/images/datasets/132x66/MOD_LSTN_CLIM_M.jpg)


![Land Surface Temperature Anomaly [Day]](/images/datasets/132x66/MOD_LSTAD_M.jpg)
![Land Surface Temperature Anomaly [Night]](/images/datasets/132x66/MOD_LSTAN_M.jpg)
![Land Surface Temperature [Day]](/images/datasets/132x66/MOD_LSTD_M.jpg)
![Land Surface Temperature [Night]](/images/datasets/132x66/MOD_LSTN_M.jpg)


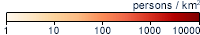
Population Density
About this dataset
This map shows how many people live in different areas on Earth. The map is divided into numerous small boxes, called "grids." Each grid box is about 1 kilometer long by one kilometer wide, and it is color coded to show how many people live there. Lighter areas have fewer people. The red dots scattered across most countries show cities, where many people live in a small area.Get Data
1. Visit here the SEDAC site
2. Make sure you create/ sign in to your Earthdata account
3. From the Data Download tab, select Temporal, File Format, and Resolution parameters and click Create Download
Related Websites
Further Reading
Credits
Imagery produced by the NASA Earth Observations team based on data provided by the Socioeconomic Data and Applications Center (SEDAC), Columbia University.
Federal Geographic Data Committee Geospatial Metadata
View the FGDC Metatdata for Population Density